There are many ways to evaluate how a team performed this B1G season. One common way is to simply look at the actual records and standings. This "absolute" approach has its merits because bottom line it's the results that matter. On that basis Wisconsin (16-2) was a huge success winning the B1G by two wins. Maryland (14-4) finished a decisive second by distancing itself over the rest of the B1G by at least two wins. At the bottom of the standings Rutgers (2-14) set a new B1G futility mark by becoming the first team to finish in 14th place. Penn State (4-14) also broke new ground by becoming the first 13th place finisher.
This type of simplistic analysis leaves us somewhat wanting because everyone expected that Wisconsin would be best in class while Rutgers would like finish at the bottom. What's more interesting to us is how teams performed relative to their expectations. This expectations-based approach -- much like the absolute approach -- can be evaluated both by examining teams records as well as by the standings. Of course there is a high degree of correlation between both approaches but there are distinctions which matter to varying degrees to individual fans.
This summary chart first compares actual records to expectations and then makes a similar comparison for the standings. The comparison of records relative to expectations are shown in the column labeled "Actual W vs Proj W". A positive figure means a team won more times than was expected (i.e., overperformed relative to pre-B1G play projections), and a negative figure means the opposite. On this basis Purdue most exceeeded expectations this winter (by 4.7 wins). Iowa (3.0) and Maryland (2.8) also had notably good results. On the flipside the biggest flop was Minnesota which achieved 4.4 fewer wins than expected. Other underperformers were Penn State (-2.8) and Rutgers (-2.4). As you can see this expectations-based analysis has much in common with the absolute approach but does uncover the fact that teams like Purdue and Iowa really came together this winter.
On a standings based approach the expectations-based performance shows wider swings of actuals relative to expectations. For the postitive surprises Purdue once again made waves by finishing in a tie for third which is 7 rungs higher than what could've been expected prior to B1G play. Iowa also climbed up the ranks by 4 rungs, and even Northwestern fans are justified in feeling pleasantly surprised by its 10th place finish which is 3 rungs above expectations. The biggest disappointment is once again Minnesota that finished in a tie for 10th despite pre-B1G expectations of a 4th place finish (including ties). We've seen some disgruntled Ohio State fans gnashing teeth about their 6th place finish, and this chart validates this discontent because the Buckeyes were expected to finish in 2nd place (including ties).
Four teams (Wisconsin, Michigan State, Michigan, and Rutgers) all finished exactly where expected in the standings. Three other teams (Maryland, Indiana, and Nebraska) finished within one rung of expectations. That is to say the pre-B1G expectations were pretty much on the money for half of the B1G teams.
The predictive powers of the kenpom projections do have their limits as demonstrated by the "P(Rank)" column which shows the pre-B1G probabilities were for where a teams actually finished. For example there was an expected 1.2% chance Purdue finishing in third and a 1.9% chance of Minnesota finishing in 10th. Those probabilities may sound low, but with 126 regular season games and the relative competitiveness of most games then any predictive model is going to have a good amount of variance in its projections. For example Purdue's predicted 10th place finish had only a 15.6% probability while Minnesota's predicted 4th place finish had a probability of 17.8%.
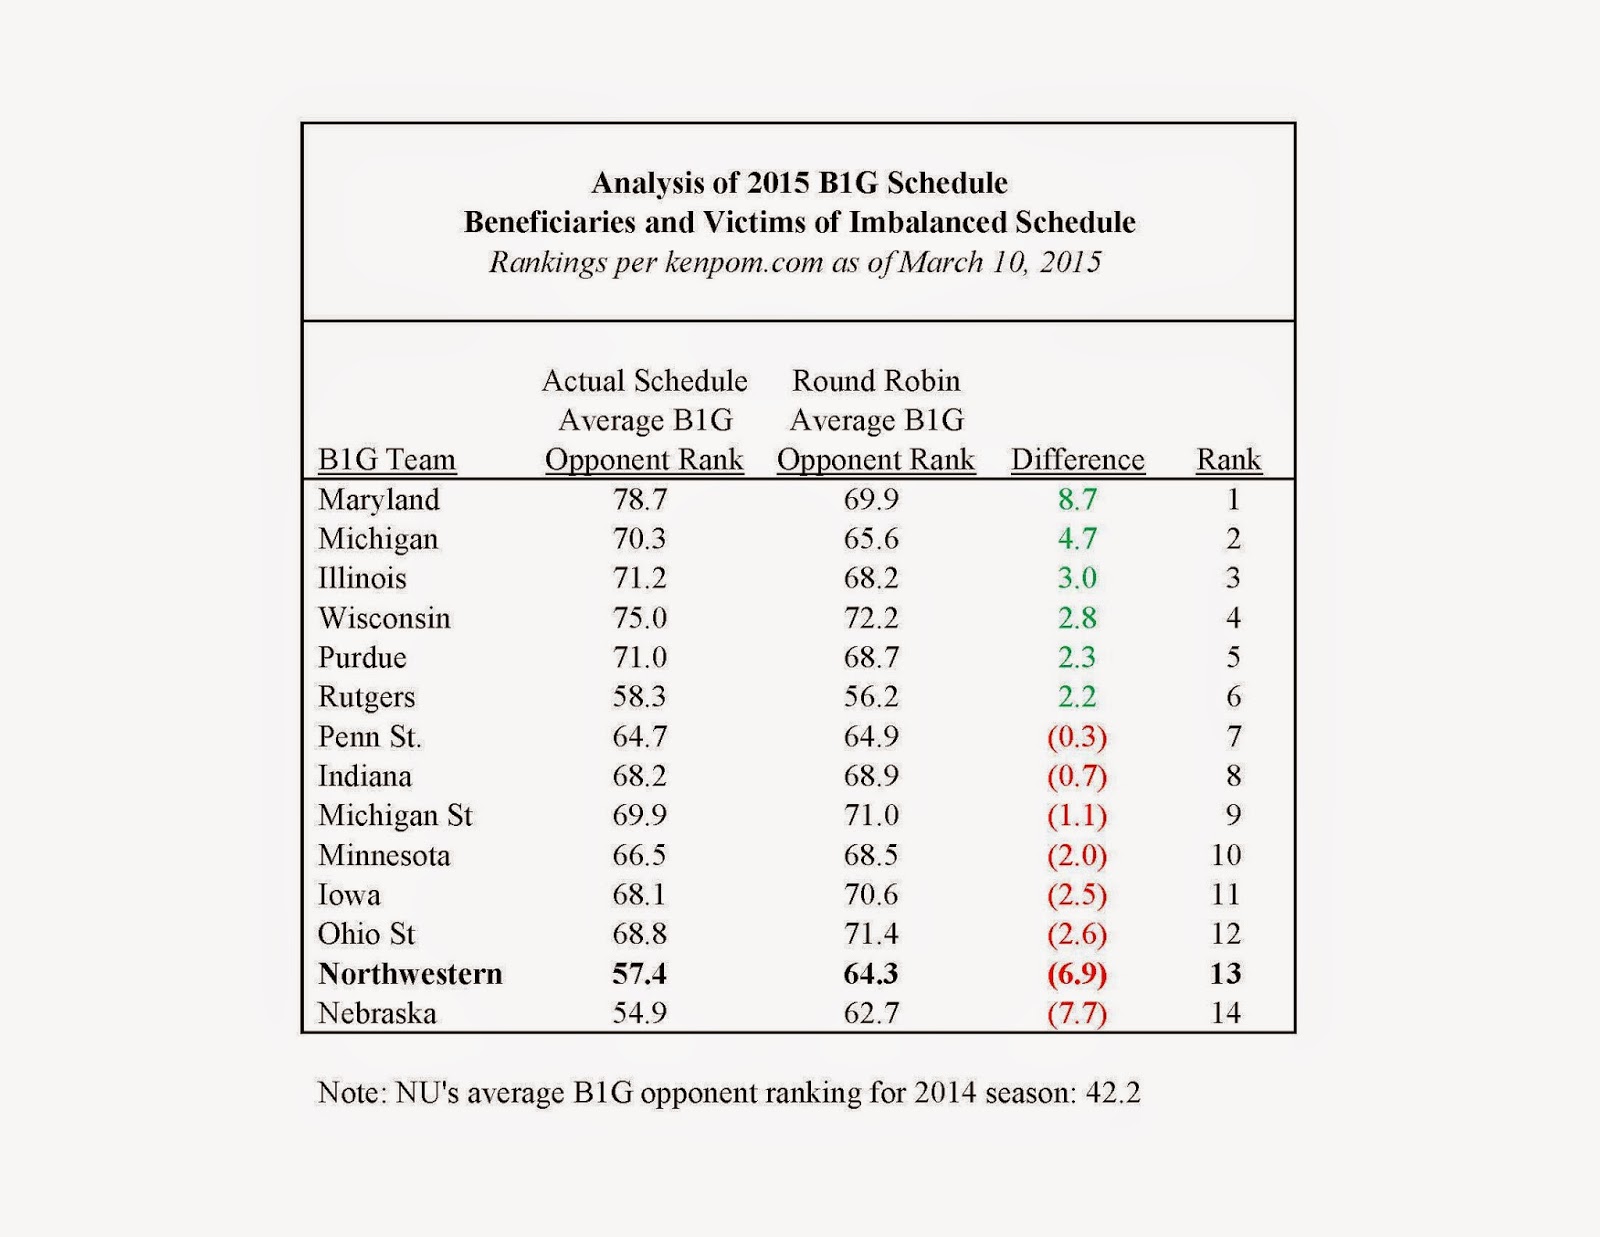
Lastly with the B1G regular season complete we can now say with more certainty which teams were the biggest beneficiaries and victims from the imbalanced B1G schedule. Maryland was clearly the biggest beneficiary as they played an average ranked B1G team of 78.7 which is 8.7 rungs worse than what they would've played under a round robin schedule. Michigan also had a relatively favorable schedule (4.7 rungs worse). On the flipside Nebraska had the hardest schedule relative to a round robin (7.7 rungs better), and the schedule makers also did Northwestern no favors (6.9 rungs better).
A few tidbits about the imbalanced schedule..... 1) this analysis is purely data driven and doesn't take into account Home/Away affects -- limited as they may be. 2) It also doesn't take into account timing of games which we would argue has some bearing on results. 3) Nebraska and Northwestern fans ought not get too bent out of shape by the imbalanced schedule; the B1G was much weaker this year than last year with wins easier to come by on the whole (see the note that NU's 57.4 average B1G opponent rank was much worse than the 42.2 average for 2014).


