27 March 2015

2015 NCAAs - Round 2 Results by Conference

We're midway through the Sweet 16 round so this post is a little late.  Alas here is the Round 2 update.


Notes:

ACC continues to march along as expected.  

Pac12 continued to flex it muscles with three teams (Arizona, Utah, UCLA) surviving to the Sweet 16 when only one (Arizona) was expected to be there.  

The modest gains earned by Ohio State in Round 1 for the B1G were given back in Round 2 with the B1G now on track (Michigan State survived in place of Maryland) 

B12 and BE continued to disappoint with Kansas and Villanova also dropping out in Round 2, respectively.

The Big East was the biggest lower with 3 conferences still have teams playing in NCAAs.  ACC has most teams remaining (6) followed by B1G (5) and Pac12/BigEast (4).  Other conferences with multiple teams remaining are B12 (3) and MVC/SEC (2).

Surprisingly MVC continued to represent thanks to a Wichita State upset of Kansas.

21 March 2015

2015 NCAAs - Round 1 Results by Conference

Round 1 is in the books.  Here's the conference breakdown comparing actuals to expectations per seeds:


Notes:

ACC went undefeated in R1 as expected.  Pac12 also went undefeated thanks to UCLA's upsetting SMU.

13 conferences still have teams playing in NCAAs.  ACC has most teams remaining (6) followed by B1G (5) and Pac12/BigEast (4).  Other conferences with multiple teams remaining are B12 (3) and MVC/SEC (2).

Losers: Big 12 (Iowa State, Baylor), Big East (Providence), American (SMU)
Winners: B1G (Ohio State), Pac12 (UCLA), CUSA (UAB), SB (Georgia State)
Wash: A10 (VCU, Dayton)


20 March 2015

2015 NCAA Tournament: Conference Expectations

Here is a chart that summarizes how conferences are expected to fair per seeding through next weekend (i.e., when Final Four is set).  B1G tied with B12 for most teams in the tourney (7), but only are expected to have the fourth most teams surviving into the round of 32.  

Time permitting we will compare these expectations to actuals as the tournament progresses.

Enjoy today's games!

15 March 2015

Gibbeting - March Madness 2015 Edition

Apparently the cleansing of Wildcat Report is still incomplete.  While the tone of this thread wasn't as bad as similarly embarrassing threads in the past, what made this runaway train special is that it rose from the dead like Lazarus in one of the responses to a completely new separate thread.   Bravo.  
The new thread also got the axe.


Here's Lazarus........


10 March 2015

2015 CCRUMMYS


The 2015 Carmody Court Awards show is a wrap.  For those who missed the telecast -- no need to wait for it to come out on Netflix  -- here are the award winners.


The CCRACKYS: Awarded for most outstanding game performances by a B1G team.  

The Glove (Best CCR-D: 0.310 PPP)
Wisconsin saved its best defensive effort for last and took home The Glove for its suffocating defensive effort at Ohio State on March 8.  The Badgers held the Buckeyes to just 48 points, or 0.8 PPP which was an impressive feat against the B1G's 5th ranked offense (adjO 108.3) at their house on Senior Day.

By the slimmest of margins that effort edged out Maryland's defensive effort at Michigan State in the Terps' first in-conference game ever (CCR-D 0.310 PPP) -- a 68-66 2OT win played over 82 possessions.


The Torch (Best CCR-O: 0.455 PPP)
The Badgers also had recorded the best offensive effort in B1G play when it defeated Iowa 82-50 in Madison back on January 20.  That nets-scorching 1.519 PPP effort came against the league's 8th best defense (AdjD 103.4).  

The league's second best offensive effort (CCR-O: 0.372 PPP) was achieved by Indiana in an 89-70 home victory over Maryland back on January 22 (64 possessions).

It should come as no surprise that Wisconsin and Indiana were in the hunt for The Torch.  The Badgers had above B1G-average offensive efforts in 16/18 games while the Hoosiers had above-average efforts in 15/18 games.  The Hoosiers' porous defense (16/18 of below-average efforts) could prove to be Tom Crean's undoing barring some March magic.  

Somehow Iowa -- the B1G's 2nd ranked offense overall -- didn't have any exceptionally great offensive games.


The Truth (Best CCR: 0.612 PPP)
The award for the best overall B1G performance goes once again to Wisconsin.  It was Wisconsin's aforementioned 82-50 trouncing of Iowa on 1/20 that earned the hardware.

In a distant second (CCR: 0.404 PPP) was Michigan State's 68-44 beat down of Northwestern in Evanston back on February 10 (55 possessions) -- a game that propelled MSU to a 6-2 finish and 3rd seed at the B1G Tournament but also caused NU's coaching staff to favorably reassess its defensive approach and launch the Wildcats into a 5-2 finish and the 10th seed at the B1G Tournament.

The Badgers had the league's most consistent overall efforts (16/18 games were above a B1G-average performance), and the Buckeyes were #2 (14/18 games).

So that means Wisconsin swept the CCRACKYS.  The Badgers really were The Truth this 2015 B1G season.


The CCRAZZIES: The 'razzies are awarded to B1G teams with the most dubious in league game performances. 


The Sieve (Worst CCR-D: -0.378 PPP)
The B1G's worst defensive effort in 2015 was mailed in by Northwestern in a 76-60 loss at Nebraska back on Feb 3 (57 possessions).  This marks the second straight Sieve earned by CCC et al.  The only saving grace in the 1.333 PPP effort against the league's 13th place offense (AdjO 92.7) was that it didn't happen at home (unlike that debacle against Penn State on Senior Day 2014).  

The next worst defensive effort (CCR-D: -0.337) was provided by the Wolverines in their 80-69 home loss to Sparty (57 possessions).  Sparty has a good offense (AdjO 109.5, 4th) but NOT 1.404-PPP-on-the-road-good.

The Mason (Worst CCR-O: -0.402 PPP)
Penn State laid the most B1G bricks in their 60-39 loss at Northwestern on Feb 21 (57 possessions).  While Penn State was far from a B1G juggernaut on offense (AdjO: 96.3, 12th) that pathetic 0.684 PPP effort came against NU which had the league's worst defense this year (AdjD: 111.5).

It may come as no surprise that Rutgers -- a team with the league's worst offense (AdjO: 89.5) -- was also in the running for a Mason.  Their 51-47 home loss to Northwestern in 62 possessions tallied a pathetic CCR-O of -0.383 which was exacerbated once again by the poor performance of NU's defense in league play.


The Angst (Worst CCR: -0.481 PPP)
The league's worst team -- Rutgers -- also turned in the league's worst overall performance. Rutgers "won" The Angst with its embarrassing 84-54 home loss (69 possessions) to a struggling Hoosier squad (4-8 over last 12 games, losers of 4/5 to end year) back on Feb 22.

Not to rub salt in the wounds but Rutgers -- which ended the B1G slate on a 14 game skid -- also had the second worst overall effort in a B1G game.  Their 79-51 loss at 13th place Penn State (63 possessions) on Jan 24 produced a CCR of -0.453.  Blech.

Sadly Rutgers underperformed an average B1G team in 17 of 18 games.  The one better than average performance was a real doozy --  a Twilight Zone-esque performance when the Knights somehow beat the formidable Badgers 67-62 in Piscataway back on Jan 11 (56 possessions).    

If it makes you feel any better Knights fans -- Nebraska had a CCR of -0.433 in their 74-46 drubbing at Iowa (61 possessions) back on Feb 22.


CCRUMMYS Summary:
Wisconsin: 3 CCRACKYS
Rutgers: 1 CCRAZZY
Penn State: 1 CCRAZZY
Northwestern: 1 CCRAZZY

2015 B1G Regular Season Post Mortem

The 2015 B1G regular season conference results are in the books.  Here is the post mortem to chew on before attention fully turns to the B1G Tournament that gets underway tomorrow.

There are many ways to evaluate how a team performed this B1G season.  One common way is to simply look at the actual records and standings.  This "absolute" approach has its merits because bottom line it's the results that matter.  On that basis Wisconsin (16-2) was a huge success winning the B1G by two wins.  Maryland (14-4) finished a decisive second by distancing itself over the rest of the B1G by at least two wins.  At the bottom of the standings Rutgers (2-14) set a new B1G futility mark by becoming the first team to finish in 14th place.  Penn State (4-14) also broke new ground by becoming the first 13th place finisher.

This type of simplistic analysis leaves us somewhat wanting because everyone expected that Wisconsin would be best in class while Rutgers would like finish at the bottom.  What's more interesting to us is how teams performed relative to their expectations.  This expectations-based approach -- much like the absolute approach -- can be evaluated both by examining teams records as well as by the standings.  Of course there is a high degree of correlation between both approaches but there are distinctions which matter to varying degrees to individual fans.


This summary chart first compares actual records to expectations and then makes a similar comparison for the standings.  The comparison of records relative to expectations are shown in the column labeled "Actual W vs Proj W". A positive figure means a team won more times than was expected (i.e., overperformed relative to pre-B1G play projections), and a negative figure means the opposite. On this basis Purdue most exceeeded expectations this winter (by 4.7 wins).  Iowa (3.0) and Maryland (2.8) also had notably good results.  On the flipside the biggest flop was Minnesota which achieved 4.4 fewer wins than expected.  Other underperformers were Penn State (-2.8) and Rutgers (-2.4).  As you can see this expectations-based analysis has much in common with the absolute approach but does uncover the fact that teams like Purdue and Iowa really came together this winter.

On a standings based approach the expectations-based performance shows wider swings of actuals relative to expectations.  For the postitive surprises Purdue once again made waves by finishing in a tie for third which is 7 rungs higher than what could've been expected prior to B1G play.  Iowa also climbed up the ranks by 4 rungs, and even Northwestern fans are justified in feeling pleasantly surprised by its 10th place finish which is 3 rungs above expectations.  The biggest disappointment is once again Minnesota that finished in a tie for 10th despite pre-B1G expectations of a 4th place finish (including ties).  We've seen some disgruntled Ohio State fans gnashing teeth about their 6th place finish, and this chart validates this discontent because the Buckeyes were expected to finish in 2nd place (including ties).

Four teams (Wisconsin, Michigan State, Michigan, and Rutgers) all finished exactly where expected in the standings.  Three other teams (Maryland, Indiana, and Nebraska) finished within one rung of expectations.  That is to say the pre-B1G expectations were pretty much on the money for half of the B1G teams.

The predictive powers of the kenpom projections do have their limits as demonstrated by the "P(Rank)" column which shows the pre-B1G probabilities were for where a teams actually finished.  For example there was an expected 1.2% chance Purdue finishing in third and a 1.9% chance of Minnesota finishing in 10th.  Those probabilities may sound low, but with 126 regular season games and the relative competitiveness of most games then any predictive model is going to have a good amount of variance in its projections.  For example Purdue's predicted 10th place finish had only a 15.6% probability while Minnesota's predicted 4th place finish had a probability of 17.8%.


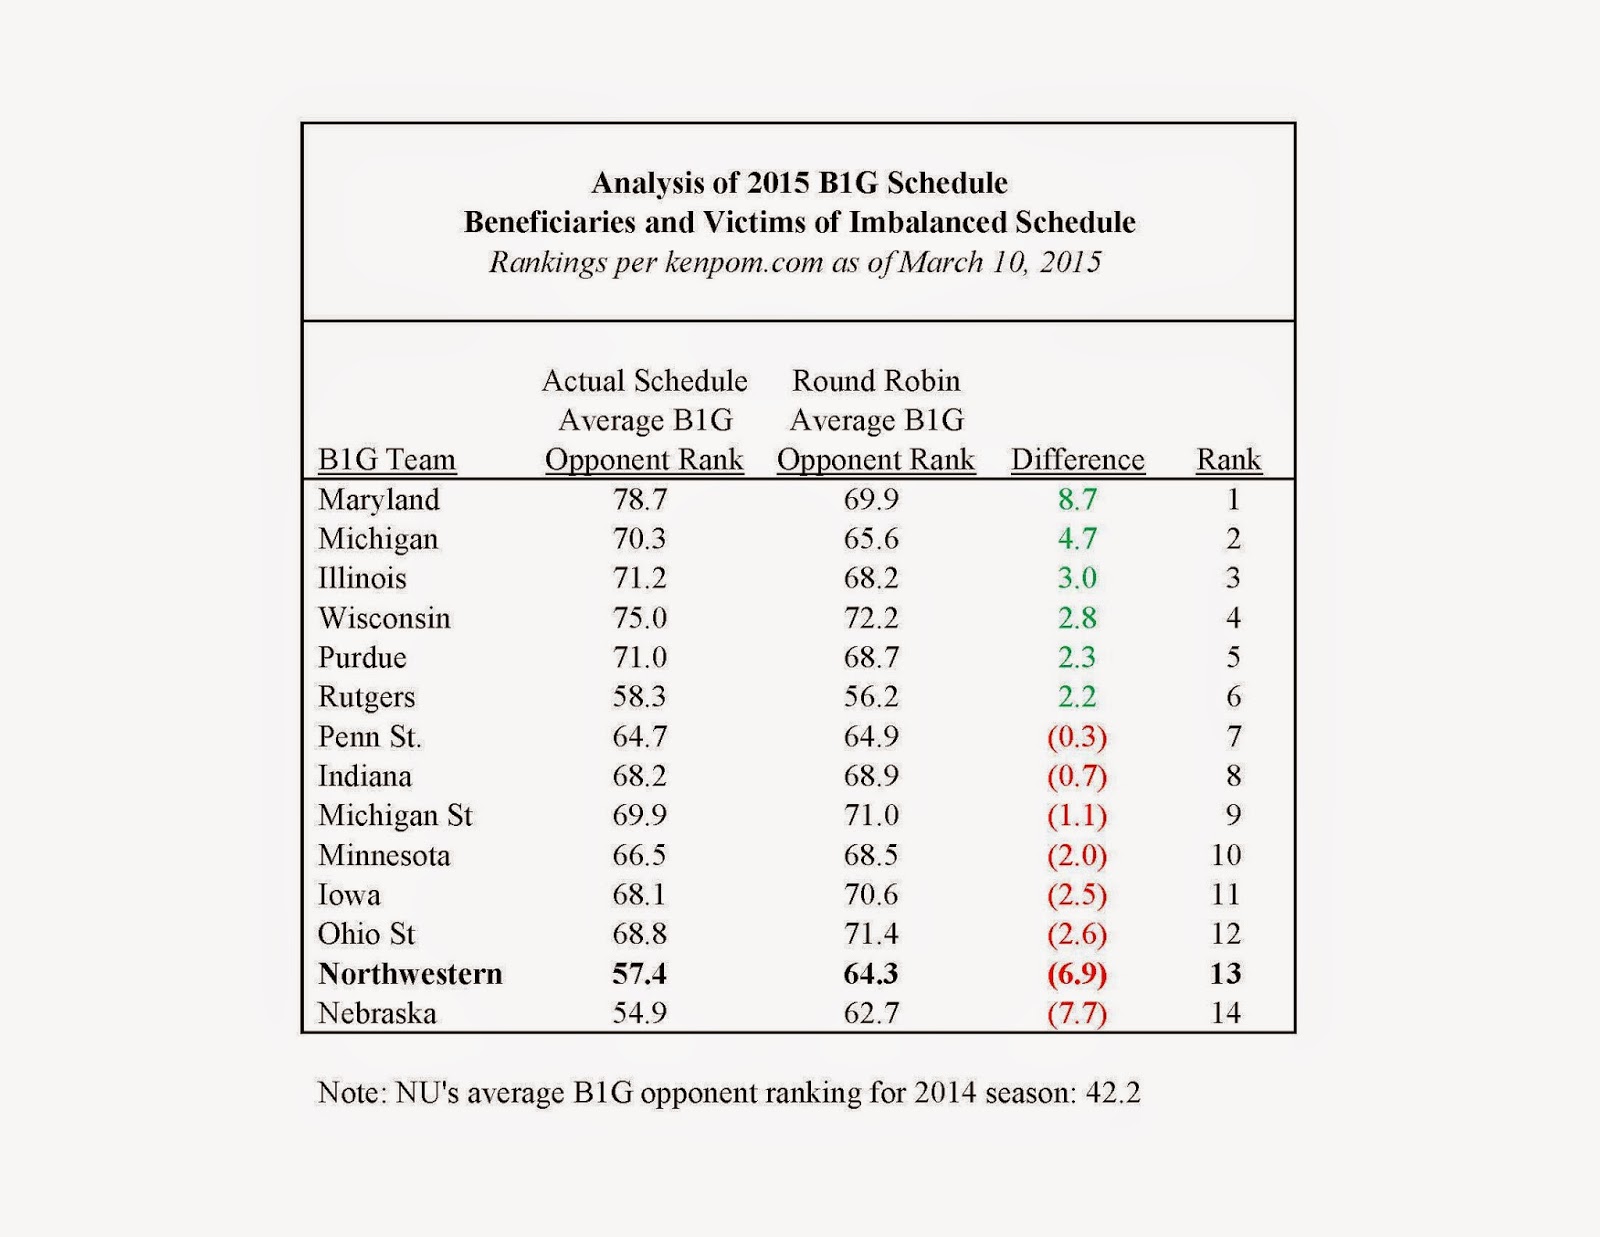
Lastly with the B1G regular season complete we can now say with more certainty which teams were the biggest beneficiaries and victims from the imbalanced B1G schedule.  Maryland was clearly the biggest beneficiary as they played an average ranked B1G team of 78.7 which is 8.7 rungs worse than what they would've played under a round robin schedule.  Michigan also had a relatively favorable schedule (4.7 rungs worse).  On the flipside Nebraska had the hardest schedule relative to a round robin (7.7 rungs better), and the schedule makers also did Northwestern no favors (6.9 rungs better).

A few tidbits about the imbalanced schedule..... 1) this analysis is purely data driven and doesn't take into account Home/Away affects -- limited as they may be.  2) It also doesn't take into account timing of games which we would argue has some bearing on results.  3) Nebraska and Northwestern fans ought not get too bent out of shape by the imbalanced schedule; the B1G was much weaker this year than last year with wins easier to come by on the whole (see the note that NU's 57.4 average B1G opponent rank was much worse than the 42.2 average for 2014).

02 March 2015

B1G Projections: Finals Week Edition

With all B1G teams set to play their final two regular season games this week we're about to enter "Finals Week".  It's been a long cold winter both literally-speaking and figuratively-speaking for the folks in Piscataway, State College, and Minneapolis.  

With just 14 games left on the B1G slate many questions have been answered.  Congratulations are in order to Bucky who has lived up to its billing.  Maryland is all but guaranteed to finish in second with a few teams hoping to join them in a tie.  At the bottom of the B1G Rutgers is going to finish in the B1G basement.  The Scarlet Knights have less than a 1 in 5 chance of sharing the basement with Penn State.  

Still there are many questions that still remain as attention turns to the upcoming Big Ten Tournament in Chicago next week.  Which other two teams will get a double-bye for the BTT?  Which two teams will be joining Rutgers and Penn State in their Wednesday tussles?  Which teams will claim the coveted third seed and thereby avoid the Wisconsin juggernaut until Sunday.

Unfortunately our standings projections do not take into account tie breaker rules for BTT seeding.  If NU were in the mix for an NCAA invite then we might be inclined to take that extra step.  Maybe next year.  As it stands Ohio State, Purdue, Iowa and Michigan State fans have the most vested interest in digging into those particulars.  Hoosier fans know that they can safely count on delaying their trips to Chicago until Thursday, but it's far from certain where Indiana will finish in the rankings.  

It is likely that Nebraska and Northwestern will need to play on Wednesday.  But if Goldy continues its disappointing B1G campaign and loses both games this week then it's possible the Huskers or Wildcats could avoid a Wednesday game.

Below are the win charts.  With two games left there isn't much left to say about these projections. Perhaps the most interesting part are the data in bottom section from which one can compare the current W-L projections against those from prior to the season. The biggest disappointments this B1G season are Minnesota Penn State and Rutgers while the biggest mover up the charts are Purdue Iowa and Maryland.  All other teams are expected to finish within two games of their pre-B1G expected win total.